This is part eight of the review. For the previous parts click here.

As last year, West put a major focus on fielding. To help with this, we continued our analysis of fielding through the Fielding Impact (FI) stat.

FI is a number that tries to analyse how many runs a team saves (or loses) through the three main skills: catching, stopping and throwing down the stumps. It is certainly not perfect as it works on averages and qualitative judgement, but it does allow us to compare effectiveness of fielding at both team and player level. Here are runs saved per game:

The first game of the season is at the top, and the average FI is the pink line. Wins are in maroon (naturally) and losses are in blue.

The first game of the season is at the top, and the average FI is the pink line. Wins are in maroon (naturally) and losses are in blue.

A few things stand out.

There is no correlation between winning and runs saved or lost.

There was also a great variation in fielding over the season (from 39 saved to 37 lost). Despite a good middle of the season, the start and end were poor. This is a trend we also saw last season.

Overall fielding may appear to have declined from last year – where West finished in the positive – however, these team stats also include half chances and harsher judgements on fielding standards than last year, meaning players are going for more catches and stops than last season. This is a positive, although it would be even better if more of those chances were executed successfully.

At a team level, we can break this down to all specific areas of improvement.

Catches

The biggest impact is catching. Taking an “expected” catch saves, on average, 6.73 runs, but dropping one costs 15.71. The old maxim of “catches win matches” is better described as “drops reduce your chance of winning”, but that doesn’t roll off the tongue quite as well.

 At club level you expect about 30% of catches to be dropped. If you catch 75% you are at a very high level. This figure doesn’t include catches where you only have half a chance or need a stroke of brilliance to pull off.

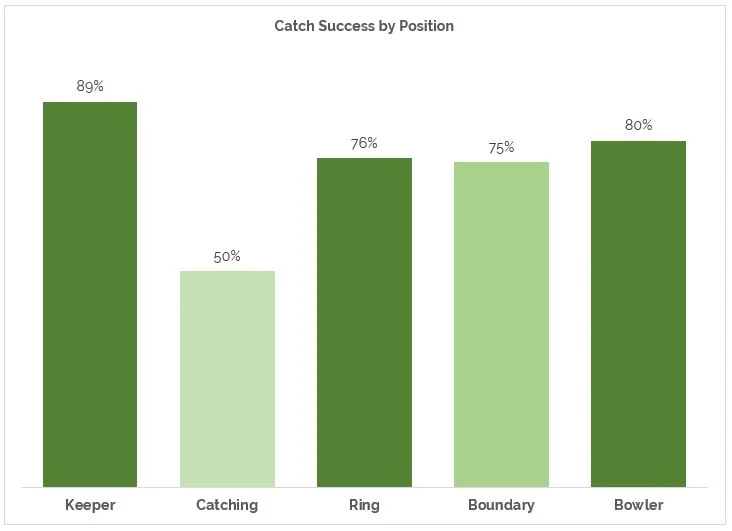
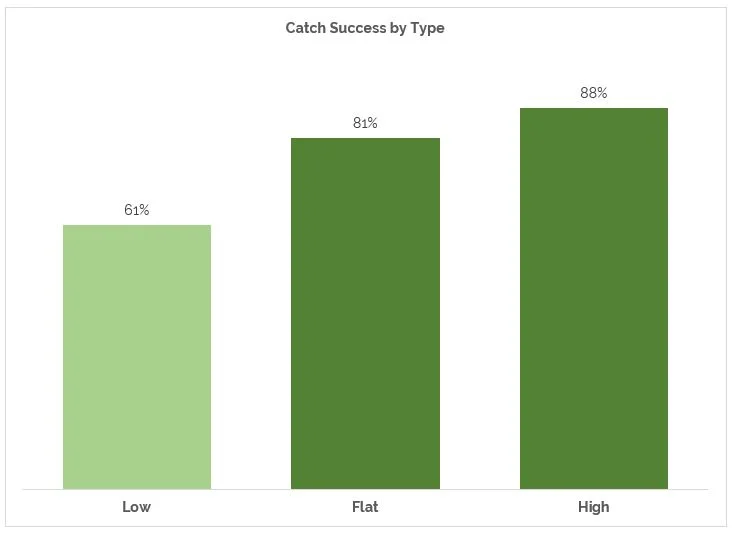
West had 73 expected chances – remember we are excluding half chances - in Premier cricket, holding 75%. This likely puts West near the top of catching for the league (although without figures it’s hard to judge). Broken down further this looks like:

catch1.JPG
Catch2.JPG

We can see top-class performance in both high and flat catches. Also, as expected, the keeper held most chances. Caught and bowled was successful but only had five chances all season. Ring and boundary catching was excellent.

Low catches had the most chances – 28 – and 11 drops making it the worst type of catch. Most of this was in close catching. 12 chances went here and six were dropped (five drops were from 11 low chances).

Drilling down, we can see the fast bowlers only had 44% of chances held by the slips. This dropped to 20% (one catch from five chances) in overs 11-20.

From this evidence, it’s recommended West look to maintain standards on most catching types but put in as much time as possible on low catch, especially at slip with the fast bowlers in the first half of the innings.

Ground fielding

Saving runs is also difficult to measure. We know – on average – a single piece of excellent fielding will save 2.06 runs. A misfield costs the same. Here is the breakdown of runs saved and given away:

runssaved2018.JPG

From this graphic you can see positional performance. The ring fielders dominated, saving a balance of over 40 runs over the season (59.68 lost, 100.85 saved). The pack of bubbles in the top left shows you little difference between positions other than number of chances. Every position was comfortable in the black. West’s ground work is on point.

The next step in development is going for more balls by developing a mindset to push harder to get to more balls.

Throwing

The final skill is throwing for run outs. This is another hard skill to measure because a throw at the stumps that misses might not have resulted in a run out anyway. If it was a clearly out miss with all three stumps to aim at, the cost was 5.61 runs. A direct hit that resulted in a run out with one stump to aim at saved 16.83 runs.

West had 45 throws at the stumps all season. 12 hit at a 27% success rate. This is below what you expect at club level, but “expected hit” throws were at 50%, which is about average.

Three (25%) of these direct hits resulted in a run out, showing how hard it is to complete due to the influence of the batsman’s judgement and speed, and the umpire’s decision making. It also shows how important it is to get as many throws off as reasonable.

Additionally, there are throws that result in a run out from a “take and break”, where the keeper or bowler executes the run out. This was counted as saving 5.61 runs. There were 10 of these.

So, in trying to account for all these factors, we can say West lost 129 runs from missed run outs but made back 62 runs from completed run outs (direct hits, or take and breaks).

The balance was -32.

This may appear slightly harsh because in club cricket we tend to see a run out as a bonus. Missing a throw is not as “bad” as dropping a catch. However, the fact remains a missed throw is still a lost opportunity for a wicket and will cost extra runs: The batsman could have been out, but he remained in and continued to score. Remember, we are trying to establish how much effect fielding has on the opposition’s final score.

Team fielding performance overall

Returning to overall team performance then, we can combine these numbers.

West finished on -31 in Premier Division cricket, which is an average of -2.21 per game.

Two runs is certainly not enough to influence the outcome of an average match. In fact, some of the worst fielding performances did not lead to a loss. For example, West had a -37 score against Dumfries and -35 against Ayr and won both. You can certainly “get away” with poor fielding as a team.

On the other hand, the best fielding performance of the year was a loss against Clydesdale, demonstrating that West’s fielding kept them in the game when they could have lost more easily. Also. the last over loss against Poloc was a +3 for fielding. There were opportunities to make FI higher which were not taken. Had FI been higher, West would likely have won as it was such a close match.

The bottom line is team fielding alone rarely influences the outcome of the game, but it can keep you in a match longer, which gives you a better chance of success. It is also much more important in close games, where it is more likely to make the difference between winning and losing.

Posted
AuthorDavid Hinchliffe

Today is the first guest article on the site. Rich Hudson is a human being who spends some time on the planet as a cricket coach and writer. Here is his view on how we play the game.

We want to allow ourselves and others to play with freedom, to express themselves, to be comfortable in their own skin, to be great teammates, to have fun and love playing the game.

To do this in cricket we must first build the foundations.

The foundations begin with our understanding. What do we understand, and misunderstand, about how the mind works? And how does that understanding impact everything we do within the great game of cricket?

The cornerstone of how we change the game of mental health and performance psychology in cricket is the realisation that our experience is always taking place from the inside-out. However, it appears to be coming from the outside-in.

Look at the situations below and ask yourself these two questions:

  • Do I feel the same way about them every time?

  • Does everyone feel the same way about them?

Nicking off for a duck. Scoring 30. Taking a slip catch. Getting hit for 6.

These aspects of the game happen to everyone. However, we do not experience them the same way because of one simple, fundamental reason – we have different thinking taking place within our minds every time that they take place. It appears that scoring a duck or a hundred, taking 5-for or getting whacked causes us to feel how we do (outside-in), but if we look closely it is always and only thought-in-the-moment creating that experience from the inside-out.

Everyone’s experience is made of a continually fluctuating thought-feeling connection, whilst we all continually fall for the circumstance-feeling illusion. How things appear are not how they are. Hearing this for the first time is different. Ultimately, it becomes transformational.

Gaining insight into the thought-feeling connection gradually changes how we perceive the challenges of the game. We see that:

  • The feeling of pressure does not come from how difficult a game is or the expectations of others. It comes from the thought in the moment that we’re experiencing

  • Nerves do not come from big games or intimidating opponents. They come from the thought in the moment that we’re experiencing

  • Confidence does not come from recent performances. It comes from… you get the picture.

These feelings and perceptions taking place from the inside-out are made of thought. The nature of thought is:

  • Transient (it passes on its own -can you remember what you were thinking this time yesterday?)

  • Illusory (a thought is a thought – it doesn’t have to be believed)

  • It fluctuates (our moods rise and fall all day, and with it, our perceptions shift)

  • You do not control it (otherwise we’d know what we’ll thinking about this time tomorrow)

Apply this to have you feel about the game of cricket. Some days you love it, some days you hate it, some days you find it the easiest thing in the world, most days it feels like the hardest! This is the transient, fluctuating and uncontrollable nature of thought, about a game which remains exactly the same as it always was.

If we strongly believe that our experience is outside-in – that our well-being and sense of self is reliant on our performances – we will inevitably overthink whatever we believe is the creator of our experience. It becomes freeing to see that everything is a temporary perception. 

Many of the misunderstandings we’ve collected over time begin to drop without effort and our experience of the game subtly, but fundamentally, shifts. When we stop taking our thinking seriously, we stop taking ourselves so seriously! We can start having fun playing the game again.

We begin to realise whether we have been playing cricket as an expression of ourselves or in a search for it?

Anybody looking for fulfilment in scoring hundreds, knocking stumps out of the ground or in amazing diving catches will not find it. They are great, great fun – and a testament to skill, game awareness, physical conditioning and more.

However, happiness, fulfilment, freedom cannot be found in what is transient. As soon as it’s taken form, it’s gone. What we are really looking for can only be found in what is permanent – your essential nature. Not your personality or your performances, but in your essential nature - the awareness of your experience, the energy of life that you have always experienced.

You are this infinite space within which all experience, thoughts, feelings and perceptions appear. The essential, unchanging ‘you’ that was there when you first picked up a bat and a ball. Before you collected and believed limiting labels about who you are, what success is and what you have to do to prove yourself.

Getting a bit deep? Isn’t that what it’s all about? We’ve realised that mental health is not found in what is temporary – e.g. results, money, relationships, status – but that those things can be enjoyed without a feeling of need or craving, when we have built the foundations on solid ground of understanding.

Foundations are deep. They provide the effortless strength to ride the waves of life, and the ups and downs of the game, with more clarity, compassion, freedom, love and enjoyment. See them evolve back into your cricket because you’ve let go of the outside-in beliefs that have got in your way for so long and come back to what’s true in this fluctuating, magnificent, inside-out existence of ours.

Rich Hudson is the Author of Pressure Myths, available on Amazon. He is an ECB Level 4 Coach and a Performance Psychologist working with a variety of teams and organisations. Get in touch with him on Twitter @rdhudson00.

Posted
AuthorDavid Hinchliffe

This is part seven of the review. For the previous parts click here. This section looks more at batting performance in Premier club cricket.

So far, the batting has focused on the different challenges of chasing and setting targets, splitting them up. However, there are areas that rely less on context to find strong areas and development areas for the team and individuals.

First, how did West play the spinners and seamers?

West batsmen faced roughly even numbers of balls between spin (46%) and pace (54%). There was not much difference in overall performance: Averages are 18 and 21, SR 60 and 57, 16 and 17 Balls per Boundary and 3.6 and 3.4 RpO.

Interestingly, West batsmen were far more in control of the spinners, playing false shots 22% of the time. The pace bowlers had 31% false shots, but only managed one more wicket over the whole season.

We can also see who played the different types of bowling better or worse.

Against spin, Abacus and Seashot outperformed both the team average and their own overall average. All other batsmen under-performed compared to their overall average. Certainly, room for improvement.

More batsmen were ahead of overall average against fast bowling. Cobra, Northflood, Bluecall and Seashot all outperformed both team against pace average and their own overall average. Abacus, Mayor and Kodak under-performed against the seamers.

From here we can look to personalise preparation for next season by working on specific types of bowling.

We can also hunt for weaker area by looking at how batsmen got out.

 The overall balance of wickets was even: 52 wickets fell to fast bowlers and 54 to spinners. There were 17 dropped catches for the opposition pacemen and 15 from the twirlers (plus two missed stumpings).

There were slightly more bowled and caught against fast bowlers, but the spinners got twice as many LBW decisions (12 compared to six). Of the catches, there was a roughly even distribution between close catches, boundary catches and keeper catches. Fast bowlers had more catches in the ring (16 to nine) and spinners took three caught and bowled while seamers had none.

Its clear West batsmen don’t have a great weakness in any area of dismissal. Although, it is worth keeping in mind any technical issues around getting LBW to spin or caught in the ring from pace bowlers. One individual point to note is a top order player with a reputation for playing fast bowling badly. Not only did he get out to spin twice as often, he also had an above par average against fast bowlers. This is one occasion were perception does not match reality.

There is very little dismissal information per batsman, however most batsmen get caught. That means Winter will want to consider why he was bowled more than any other dismissal.

On the other side of the coin; Northflood and Cobra did not get out LBW all season. This is remarkable for two top order batsmen. Even more so when you note that there were only seven LBW appeals between Cobra and Northflood all season.

Luck in batting

Of course, what we don’t know was how many of dismissals came through good bowling or bad batting. This is somewhat measurable by looking at a few key factors that show how much “luck” West had.

First is fielding. It’s lucky for the batting team when a catch is dropped, or a piece of fielding leads to extra runs. West tracked this information in 2018 to see the difference. Of course, even when you know how many unforced errors there were, it’s hard to calculate exactly how many extra runs poor fielding gives you, but based on average scores we can see:

luckfielding.JPG

From this table, it’s clear West both had more chances and sneaked a few extra runs compared to the opposition. West batsmen were dropped more, and opposition fielders made more errors than West fielders. The run cost averages out at a clear 10 runs different per game.

After fielding errors, we can look at runs scored in ways the batsman was not in control; edges or mis-hits. The more runs scored this way, the luckier the batsmen.

West played a false shot 26% of the time, resulting in 13% of all runs scored. The combined opposition played false shots 27% of the time, resulting in 16% of runs scored. West certainly had a little less luck when it comes to runs scored.

Breaking this down to individuals, Northflood score more runs from false shots than anyone (46), but also played more. He scored runs when he wasn’t in control and got away with it for about the average amount of time (6.02 is dead average for West). Cobra played the highest percentage of false shots but scored from far fewer of them. You could say both gave more to the bowler than average, but Northflood scored while Cobra played and missed.

Abacus easily played the fewest false shots and scored just 8% of his runs this way (average is 13%). He also had almost 8 false shots per wicket. Through his style of play, he has attempted to reduce the influence of risky batting dramatically: He stopped scoring lucky runs and reduced his chances of getting out through a false shot.

Seashot had a False Shots per Wicket rate (FpW) of 9, getting away with it almost three times more often than Bluecall. The pair were roughly the same in runs scored from false shots. You could certainly say Bluecall was unlucky compared to the average, but you can also say that Seashot’s false shots were less likely to get out because he played in a less aggressive manner. There’s a hint again here that Seashot could increase his intent relatively safely as he has three false shots to play with before he returns to average levels.

Overall, tradition dictates that the more aggressive you play, the more likely you are to get out but the faster you score. This analysis shows the picture as a lot more nuanced, and batsmen need to learn their own game to be able to make small adjustments along the cautious-aggressive continuum. The key question – especially in limited overs – is “how hard can you push it before risk overtakes reward”?

Shot Performance

One way to look at this further is to break down performance by shot (all formats).

shotperformance.JPG

You can easily see in the graphic that glances are the safest and most effective run scoring shot (even more effective than the defensive block). The shot averages 128.00 - as show by bubble size – and takes 137 deliveries before a wicket falls (BpW). It is also the best strike rotation shot, with an SR of 93 and a high control percentage of 85% showing a very low number of false shots.

In fact, it’s also interesting to note that shots designed to rotate the strike are also much less likely to get a wicket than either pure attack or pure defence. The flick, push and glance combined have a better average and higher number of balls per wicket than other shots. It can be argued rotating the strike is the best way of not losing a wicket.

As expected, attacking shots have a greater SR but a lower BpW. The pull shot is an outlier, played mostly to an especially bad ball, the risk of getting out is lower than most attacking shots, including the drive. As a result, the pull shot has the second-best average of all shots.

Driving is less reliable than you might imagine, suggesting room for improvement in a range of batting situations.

Sweeping is played rarely because it is relatively high risk. Although the reward of an SR of 161 is possibly worth it more often than it is played.

The cut is the least valuable attacking shot, not yielding many runs per wicket, and forcing a lot of false shots. The runs that did come were at a lower rate. As the cut is usually played to a bad ball, there appears to be an opportunity for better execution. Although, it was also the attacking shot played least often, suggesting batsmen are aware of the risks. As 11 different batsmen got out cutting, it’s certainly not down to one person.

Strike Rotation

From the above, it is becoming obvious that “strike rotation” is a safe and effective strategy. You are less likely to get out and you score at a decent rate (about four an over). However, it is hard to achieve, with every batsman missing out on chances to rotate.

This leads to the question; how good are West at rotating compared to the opposition?

For the purposes of this comparison, we will assume some things: A ball rotated is when runs are scored from any shot that is under control. It does not include boundaries or shots edged or otherwise miss hit. Ideally, we would examine the line and length of the deliveries, but we don’t have that so instead we will take strike rotation literally and say it’s any shot where the batsman has deliberately scored 1-3 runs (even if his intent may have been to hit a boundary).

By this measure, West rotated 27% of their controlled shots and faced a dot 43% (the rest were boundaries, leaves or false shots). The opposition combined scored 24% and 46%.

That works out as 75 runs per game rotated for West and 69 for the opposition. The difference is very small.

The conclusion is simple: Teams are all about equal at rotation and all miss a lot of opportunities to rotate. Over 90 balls every game are played under control but result in a dot. Of course, not every delivery is a chance to score, but it does show there are opportunities. A team who can take 10% of these chances to score will gain, on average, 13 extra runs.

This shows in the performance of Stirling against West, Stirling set both the highest total to chase and made the highest chase of the year. They had controlled rotation at 32%, resulting in 107 runs scored per game, a boost of almost 30 runs on the average.

With the example we can see there is certainly an opportunity to look to rotate more often with focused practice on specific shots such as drop and run, glances and pushes. For example, a controlled push (a straight bat shot mostly played into the off side) results in a dot 49% of the time. A drive – the more full-blooded version – is 24% (but fewer shots are controlled). A batsman with more control over straight bat shots can angle the ball into gaps more often and increase these numbers without a noticeable increase in risk.

All that is more foo for thought than any clear conclusions, but in many ways, this is what useful analysis is about: posing questions that require players to come up with effective solutions.

Speaking of which, the next part moves on to fielding.

Posted
AuthorDavid Hinchliffe
OCTOBERWEEKCRICKET.jpg

If you are a Glasgow-based cricketer take a look at this offer for 15th-19th October 2018:

Improve your cricket with small-group batting and bowling coaching during October Week. 

High levels of coaching time with Western Warriors Youth Coach David Hinchliffe. Perfect for aspiring players from 13-17 years. 

Places limited to six players per day. Book now to avoid disappointment.

£20 per session, £35 per day or £150 for all 10 sessions.. Hosted at West of Scotland CC Indoor Nets (Peel Street, Glasgow).

Contact here.

Posted
AuthorDavid Hinchliffe

This is part six of the review of the Premier Division season for West of Scotland. This article looks into the chasing skills of the side.

West were great at setting up the game with the ball, but that’s only half the job. How did West do with the bat?

Tactically, the main difference is knowing what you are chasing. You can alter your approach based on the score. For example, you can feel safe batting more slowly chasing a score with a high Win%. Whereas, necessity insists you bat faster when chasing an above par score. Three an over is plenty chasing 100 but will quickly put you behind the rate chasing 300.

We can judge how difficult a chase is by Win%, and by this measure, West won a single game against the odds but lost two games from a winning position. The other matches went to form.

We can get a sense of how these games went by looking at the margin of victory.

chasewinmargin.JPG

This graphic shows how West did in won chases. The closer to the top right of the chart, the easier the win, the closer to the bottom left, the closer the game.

The size of the bubble represents the chance of victory at half time. You can see here West had comfortable wins against Clydesdale and Ayr, and closer ones against Greenock (where time was not an issue, but wickets fallen was) and Dumfries.

How was this done? Each chase is different, so let’s pick one specific example. The match against Ayr looks like the most confident performance: Winning by six wickets with balls to spare despite the halftime Win% at 48%. Here is the change in Win% over West’s innings:

winvsAyr2018.JPG

As you can see, after a solid start three wickets (the dots on the chart) fell between over 10-18.

This caused a slowing of the run rate and a dip to 27%. This was a key moment. The West batsmen took about 30 balls to stabilise, then accelerated significantly up to the 32 over mark, peaking at 77% after 32 overs when a wicket fell.

The new partnership, after a dip, gradually pushed the % back up. In the last 20 balls of the match, the RpO jumped quickly and West won with balls to spare: A well-managed chase, featuring a chunk of the game where there was a significant risk of failure.

You can see clearly here how dynamically managing the chase depending on the situation is far more relevant than average scores. 

To compare, let’s see a game that was lost.

lossvsUddy2018.JPG

Chasing a slightly below par score, West took the Win% get to its highest point at 61% after 10 overs. There was a 100+ partnership, but the pair left the Win% the same as when they got together. Remember, against Ayr a much smaller run partnership had added over 30% and made the final run-in much easier.

From here, there was a collapse with three wickets falling in a short time and the Win% dropping, as expected. At 34% with only 100 balls left, there was precious little time to consolidate, and wickets tumbled to defeat.

While the collapse of nine wickets for 67 runs is an obvious failing of the middle order, it could be argued the big stand made the collapse more likely because there was less margin for error. In this way the stand of 80 in the Ayr match put West in a stronger position than the stand of 112 in the Uddingston match.

This comparison does bring up an important question: How late can you leave a push for victory? Against Ayr, there were more wickets early on, and the Win% dropped much further. However, an attacking recovery made the difference. Against Uddingston, a push did not come despite a bigger stand. Of course, the batsmen were not to know a collapse was going to happen in the latter case. Yet, with hindsight, would a higher Win% at 30 overs have given the team the same increased sense of security even during a flurry of wickets? We can only guess based on limited evidence, but it certainly seems logical to assume an earlier push is more effective.

The leads into the psychology of a chase. Of course, we can’t measure how either anxiety or over-confidence influences a chance of victory, However, we can get close by using Win% as a measure. In the Uddingston example, it’s possible to imagine a scenario where the batsmen building a big stand were so comfortable with “ticking over” around 50% they did not account for the potential of a collapse. You can also imagine a sudden drop in Win% can steel a pair to counter-attack as they are aware they need to improve the rate.

One interesting game from this lens is the loss to Ayr.

West were at 98% chance of victory at 145-2 chasing 181. Then four top order wickets fell for one run, and another six runs later. Five wickets in 17 balls is an extraordinary loss of wickets. Even from this point, the Win% was high with just 2.38 an over needed, but with seven wickets down, the tail did not wag.

Could the mindset of losing quick wickets been to worry about another collapse and therefore cause it?

The only clue is in how the wickets fell.

Three catches behind the wicket from three chances suggests good bowling and fielding was at the root of it.  There was also 44% of balls beating the bat (including the catches) during these four overs, highlighting that Ayr certainly had more luck regardless of whether this was via bowling skill or batting nerves. Certainly, only one attacking shot (a pull) was played in this phase, suggesting there were not many terrible balls to attack. However, we can’t be sure as no batsman had much time to define a tactical approach.

If it was great bowling, there is little one can do. However, if it was batting nerves, one suggestion is to counter-attack more quickly after a couple of wickets. This carries more risk, but also gives a psychological boost when it works(as it has for West is 2018).

All we can do in analysis is highlight these points and ask batsmen to be mindful in the moment of making decisions that they feel will give the best chance of success.

The truth about false shots in the chase

Picking up on playing and missing, this element adds to the feeling of winning or losing a game.

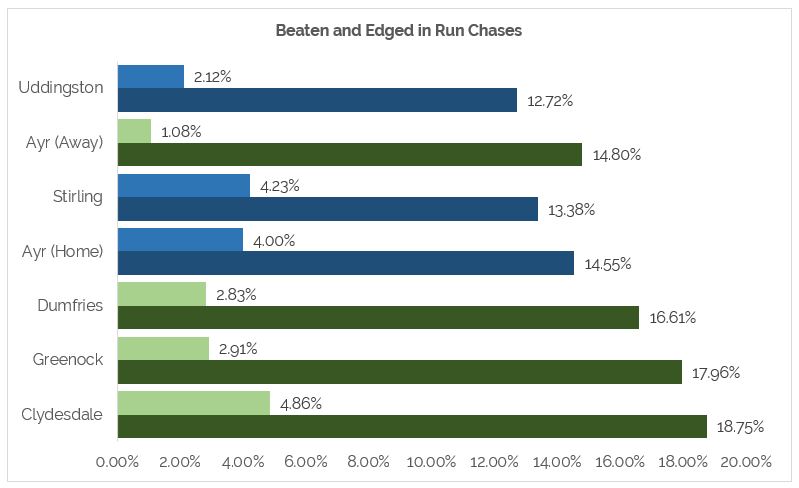
A game where the ball is beating the bat regularly feels like you are losing. However, looking at the stats we can see this is not true:

chasingfalseshots.JPG

You can see the games lost in blue are also the games with the fewest edges or ball beating the bat. The games won – in green - saw more balls beating the bat. There is no correlation in run chases between result and how much you play and miss (or edge) the ball.

This shows players they should have nothing to fear from the ball beating the bat, as long as wickets do not fall.

Overall, we can see chasing was a strength of West in 2018, with some notable exceptions. West have shown chases can be managed as a team, even under pressure. That said, the lessons from the collapses are to develop a more assertive, flexible tactical approach that gives a robust ability to manage any situation, no matter how dire.

The next part will take a more general look at the batting, including how West played spin, dismissal types and shot averages.

Posted
AuthorDavid Hinchliffe

This is part five of the review of the Premier Division season for West of Scotland. This article examines how the team did bowling first in 50 over games.

Historically, batting second has been less effective in league cricket. In 2018, the trend switched to a fifty-fifty split and West swapped totally to being far more successful chasing.

When bowling first, West’s average target to chase was 193; slightly lower than the average league score of 197. When chasing, West reached an average of 170, with a smaller variation in scores than batting first. (214-118). Games that were chased successful averaged 6.25 wickets down in 263 balls (44 overs). Lost games were an average of 59 runs short, all out in 233 balls (39 overs). Another indicator that West’s batting tends to follow the average of large margins.

It is perhaps a sign of bowling strength that West only had one above par score to chase, especially in a season of high scores across the league. Here are those games:

chasewinpercentage2018.JPG

As you can see there are no correlations between result and the main indicators of bowling success. This would make sense, as the bowlers set the game up, but the batsmen still must do their job.

There is one correlation; Win%: This figure is worked out by the difference between the par score at the ground and the actual score. It’s indicates where a team is at half time. In almost every game won, the opposition scored at least 20 below par making the win% between 72-80%. Only one game in this group was lost. It is certainly a testament to West’s bowling first plan that five opponents from seven did not get to par, and the average Win% was 60.33%.

You can argue, then, that West’s bowling set up most games, only once allowing an opponent to get away with an above par score. The spinners were not quite as effective as the seamers, suggesting seam can be used more in the first innings.

Of course, this analysis only looks at runs because the only measure of success is keeping runs to a minimum. However, this ignores the impact of wickets during the first innings. Wickets do the following things:

  • Slow the run rate.

  • Increase the chances of a side being bowled out before 300 balls are bowled.

So, while wickets are certainly important, they are also hard to work out their value. What’s better? figures of 0-30 or 4-50? Pure Win% would say the 0-30, but if the wickets lead to a side being bowled out, 4-50 is better. It’s very dependent on how the whole team does.

What this means is when bowling first, you have two chances to succeed; keep the opposition below par with tight bowling and bowl the opposition out. The former has a stronger correlation to wins in West games.

You can, of course, focus on both. A series of dots will increase the chances of a wicket. However, often you must choose between containing or attacking. In these moments, knowing West’s best chances of success come through containment (bowling first) is a key factor to understand.

How did West do on the wicket-taking element? The bowlers took wickets at a useful rate bowling first. The average for the league is 7.38 wickets per game. West averaged 9.29. 10 wickets were taken 57% of the time, better than the league overall at 44%.

Here are the averages for bowling first:

Bowlfirstaverages.JPG

Overall BoA is kept low thanks to Northflood, Kodak and Winter. Quicksky will be slightly disappointed to not take double figure wickets, especially as he beat the bat more than average. Lowtop was noticeably less of a threat in the first innings than the second. A development point for Lowtop is to work his first innings plans, be that dot bowling or wicket taking, where he has been solid but not as destructive in either discipline.

SR is better bowling first than second, mainly thanks to Northflood, Kodak and Winter. Winter was a totally different bowler between the two, looking like a superstar when bowling first, and a dot ball specialist when bowling second (the opposite of Lowtop).

It tells a tale that those with the best wicket-taking skills are mostly those with the best Win%+. There is clearly a link, but it’s not crucial. Bowlers can take this knowledge and develop themselves, knowing how best to use the skills they have, and gain some new ones over the winter.

Following on from this, we will look at batting second to see how well the batsmen paired with the bowlers.

Posted
AuthorDavid Hinchliffe

In part four of this review of the club cricket season, we look at how the team bowled overall.

Bowlers are less troubled by game situation than batsmen because they have the same goal most of the time: Concede as few runs as possible and take wickets. Dots and W’s are universally useful.

Let’s see how West did overall:

2018bowlingWoS.JPG

Even in these days of detailed analysis, the humble Bowling Average (BoA) and Strike Rate (SR) are still powerful indicators of good bowling. In the WDCU Premier Division, a BoA below 20.00 puts you in the top bracket, and below 17.50 puts you in the top 10 (best was 13.38). Top SR is in the 19.00-30.00 range.

As the green indicators show, three bowlers achieved a competent BoA and two SR. The spinners outperformed the seamers by this measure, which is reflective of the league overall where five of the top six wicket takers were spinners.

One way of comparing bowler’s performance without the influence of conditions and opposition strength is by Strike Rate Ratio (SRR). An SRR of 1.0 is the exact average strike rate for the team.  The higher above the worse you bowl, the lower the better. This means we can also compare strike rates over the last three seasons. Here are all the bowlers with over 200 deliveries between 2016-18:

relativeSR1718.JPG

Players in italics are no longer playing as they are overseas players. As you can see, Lowtop is the best wicket-taker over the last three seasons by this measure. You can also see the below-par wickets of both Winter and Kodak.

Speaking of wickets, there were four types of dismissal (minus one stumping and five run outs) with most wickets falling to catches, as you would expect. However, with almost 45% of wickets falling to bowled or LBW, it’s clear West attack the stumps, especially Winter.

The seamer was the best example of the above. He took 59% of wickets this way (more LBWs than anyone else despite his protests). Alongside the one wicket he had caught by the keeper or slips all season, you can see how he is effectively a stump to stump bowler. Comparably, Quicksky got 28% of his wickets by attacking the stumps but had eight of his 13 catches taken at slip or by the keeper.

The main spinners also seemed to have complimentary styles. Lowtop had more bowled and LBW (he also got the one stumping), Northflood had more caught, most often through mis-timed drives and pulls caught in the ring (six out of nine outfield catches).

Chances and false shots

Going together with actual wickets is the chances a bowler creates. Not every edge goes to hand, not every miss-hit is caught. The more opportunities for a wicket, the better the bowling.

The bowler with the most wickets also had the greatest number of dropped catches. The ratio stays about the same for all the top bowlers. Winter may consider his 63% catches unlucky and Lowtop might be happy to see fielders held the ball 78% of the time from his bowling. But that is only a difference of one drop all season.

Not every piece of bowling skill ends in a chance though. Let’s also look at false shots; play and miss, edges and shots where the batsman was not in control.

With the average opposition side playing a false shot 27% of the time (26% for West) the stand out bowler at drawing a bad shot is Kodak. He was the only bowler to “win the ball” more than 200 times with a 31% rate. However, just to show that winning the ball does not guarantee wickets, even though Kodak induced far more false shots, the conversion was one of the lowest, needing more than 11 bad shots before he got a wicket. Northflood was the reverse, converting his lower number of false shots into wickets almost twice as often. This could be because Kodak beat the bat a lot more than Northflood.

Speaking of beating the bat, we can also see a possible reason why the leg spin of Bridge was unsuccessful in 2018 (dropped after six matches). His bowling did not produce many false shots, and he was least likely to get a wicket with one. He beat the bat more but found the edge less. Of all the poor shots played to his bowling, 63% did not find the edge (compared to 48% for the other two spinners) and 5% did (compared to 13%). In short, this analysis concludes he was turning the ball past the edge without threating either the stumps – for bowled and LBW – or the edge of the bat for keeper catches (zero chances all season).  

Phase performance

Moving on, performance at different stages of the innings offers an insight into strong and weak spots in the attack.

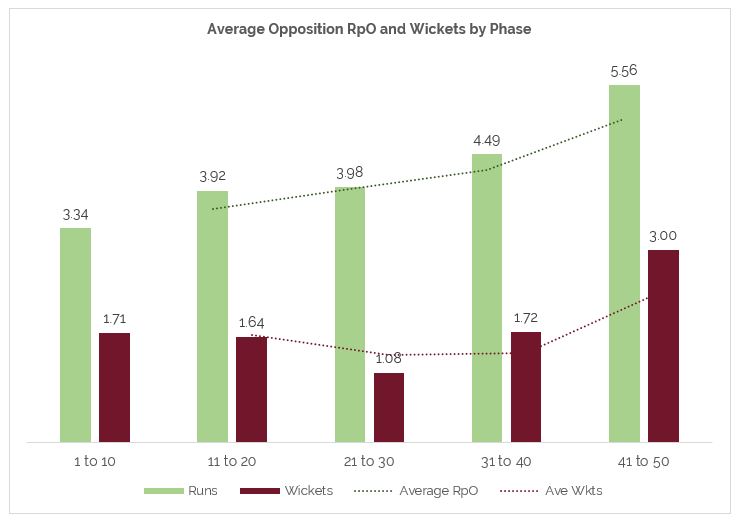
RpOW-oppo2018.JPG

The trend line for runs is similar to West’s batting; a gradual acceleration. Wickets fall evenly through the innings, with most falling at the back end.

There is a sign of problem in the middle overs where average wickets dips to 1.08. On the plus side, the opposition rarely did well at the death, keeping the average RpO below six.

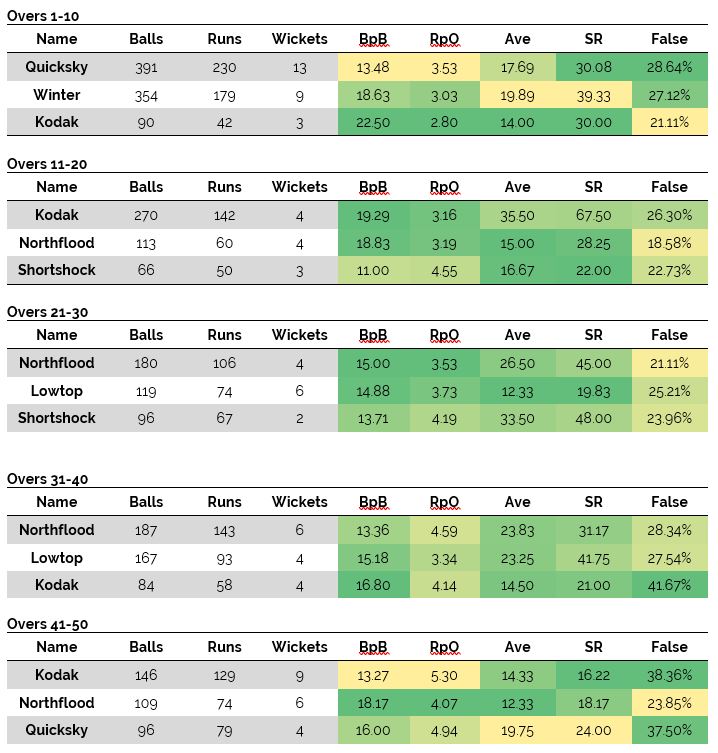
Top performers in each phase (minimum of 10 overs bowled) were:

phasebowling2018.JPG

The colour scale goes from green (best) to yellow (worst). You can quickly see who did best in each category at each phase:

  • Opening: Quicksky, Kodak

  • Early Middle: Lowtop, Northflood, Shortshock

  • Late Middle: Lowtop, Kodak

  • Death: Kodak, Northflood, Quicksky

McCallum also bowled effectively but does not appear here because he only bowled 22 overs all season.

You can also see strike rates go up in the middle overs, and with a quick comparison we can see why:

SRcomparison2018.JPG

The spinners maintain a reasonable if slightly high SR, topping at 38. The seamers, after an effective start, saw the SR go up past 100 before getting it back under control in the last 20 overs.

The faster bowlers rarely had good wicket-taking form in the early middle overs.

One solution to this is to find better seamers for that phase, but the number of false shots did not change much either, suggesting the batsmen were not dominating, merely getting out less often. Despite a similar level of false shots, there were fewer chances and more drops in these overs.

chancesbyphase2018.JPG

The lowest catch percentage was in overs 11-20 and there were zero chances in the following 10 overs. This suggests drops in the first 20 overs ended up costing West in the next 10. It also explains why paceman strike rates are so high: A severely weakened key dismissal. Perhaps the solution for the seamers is to try and hit the stumps more and rely on catching less in the middle overs.

Runs conceded

As we have touched on runs conceded, let’s go into more detail.

shotbreakdown-bowling2018.JPG

Attacking shots yield faster scoring at higher cost. The classic example is the pull shot, with the highest strike rate and RpO, but a relatively low average and Balls per Wicket (BpW).

Rotation shots like glances and pushes have a high average and are where the batsman is most in control but slow the scoring rate. You would imagine defensive shot to be the safest, and that is certainly true of the leave. However, the block is most often played when the batsman gets a good ball, meaning he often gets out to it. On the other hand, the leave is by far safest.

This means the best approach is to try to get the batsman to play pure defence as much as possible by attacking the stumps. The risk is opening the glance and flick through the leg side.  So, attacking off stump is safest.

This is not news. However, there is a secondary tactic that is possibly underused: fast short pitched bowling. This is based on two things: the effectiveness of West’s bouncers and the high risk of the pull shot. The bouncer was bowled 28 times by West – in only seven games – and took three wickets for 11 runs (two boundaries). That’s a great performance. Roughly half were attacked by the batsman but even counting just these balls, the average was 11.00. Meanwhile, the pull shot – played to short, straight balls mostly – averaged 24.60 (five wickets for the seamers).

The conclusion here is the bouncer can be used more, if the bowler is confident of getting the ball above the waist (if the ball does not bounce above the waist it can be worked off the hip at 90.25 against seam).

When wickets are hard to come by in overs 11-30 IS a good time to consider a wicket falls every nine bouncers bowled.

Going back to defensive shots, the block is a rough indicator of how well a bowler is bowling. While not always the case, it is true that a good ball is mostly met by an attempted block by the batsman. The more attempted blocks the better the bowler’s accuracy.

Kodak forced the most defensive shots, but spoiled the party with a high number of wides. The next three bowlers kept defensive shots high and wides low. This is did correlate to RpO with all three having average to excellent rates.

It seems once defensive shots drop and wides go up, so does RpO as Bridge and Shortshock dipped below 27% with a higher number of wides. Both had a redline RpO (over five). Quicksky is the outlier, looking very much like a typical wild strike bowler. He took 18 wickets at 24, but had fewest defensive shots played and bowled most wides. As a bowler who prides himself on accuracy, Quicksky certainly has work to do in the off season to get back to his best.

Returning to RpO; the measure is a good general indicator of performance for bowlers to keep the rate down. Here are the West bowlers “run saving” stats:

runsaving2018.JPG

Winter is the stand-out dry bowler here, with top scores in every category. Kodak is not far behind in comparison. Northflood stands close by, which is excellent for a spinner who bowled almost 20% of his overs at the death. Below the redline are three bowlers who failed to impress, although Shortshock will feel slightly unlucky as he bowled as many dots per over as Quicksky but went for more runs per over.

We can also get an idea of the number of bad balls a bowler is serving up by looking at Balls per Boundary (BpB). The higher the BpB, the fewer bad balls a bowler delivers. However, this stat also includes good balls that go for a boundary, such as edging the ball down to third man. A more accurate measure is the number of boundaries scored with the batsman in control of the shot. This is BpCB (Balls per Controlled Boundary).

Winter and Kodak lead the way in overall BpB. They bowl fewer four balls than any other bowler. These two also see a big jump in deliveries when you remove boundaries from poor shots. Winter sees an extra 3.34 added. The other bowlers who benefit are McCallum (5.66) and Quicksky (2.59). These bowlers bowl fewer bad balls that go for a boundary, but it looks worse than it is because more of their good balls hit the rope.

Northflood is the spinner who goes for the least boundaries. He is also one the bowlers to benefit the least from BpCB (1.34) meaning not many of his good balls go for a boundary. The other spinners have a similar story, but clearly bowled more bad balls that were put away (especially Bridge with a BpCB of 10.46, the third worst of all bowlers).

The most important conclusion from all this is to bowl as many good balls as possible.

This is not rocket science of course, but by attempting to remove the influence of fortune on bowling performance we can get a truer picture on how bowlers will achieve this.

For example, Winter is far and away the most accurate bowler in the team (most balls defended, most dots, least number of boundaries), and is about average for beating the batsman yet took wickets slower than almost any other bowler. His off-season preparation needs to focus on either becoming more of a containing bowler with the old ball or developing a new way to take wickets.

Another example is Lowtop, who tends to buy wickets more often: His run-saving numbers are all about average for West (which is slightly below average for the league). However, he has the good habit of having the chances he creates taken more often. The has led to the best BoA and SR in the team, and an especially strong performance in the middle overs. When defending a total, he has been expensive but also takes wickets. His role is a strike bowler. The development opportunity for him is to learn how to bowl more defensively when needed, or to look to ways of generating even more chances for wickets (in case his luck ever runs out).

In the next article, we move on to bowling performance in the first innings, as part of an analysis of the team’s ability to chase a target.

Posted
AuthorDavid Hinchliffe

This is part three of the cricket season in review. This article analyses the bowling in the 2nd innings of limited overs Premier Division cricket.

Whatever you run target you set, the flip of setting runs in limited overs is having a good defence with the ball.

In West’s two games won, the opposition were bowled out 66 runs short. This is a trend that is true across the league, where - in chases - 10 wickets occur 79% of the time, 63 runs short on average. In the losing games, West took 5.5 wickets on average. Slightly better than the 4.8 league average, but not enough to warrant an excellent performance.

Two of West’s games batting first went to the last over. Both resulted in losses that could have easily been wins by a close margin. Nevertheless, there are very few close games in the league. Most matches have a large winning margin, whoever wins. This was broadly reflected in West’s performance: The average win by 60 runs, the average loss by 5 wickets.

SO how do you measure your performance accurately in these situations?

One of the best ways to see how well you defend a target is through Win%. It’s more useful because it considers the context of the chase. Other stats can’t do that. The result is great knowledge of performance with the ball: If you can’t defend a low Win% from the opposition, you are being out-skilled:

Win% at half time per game bowling 2nd (Clydesdale match DLS adjusted)

Win% at half time per game bowling 2nd (Clydesdale match DLS adjusted)

Five games went as Win% predicted. Two games bucked the prediction, with Stirling putting in the most outstanding chase against the halftime odds. West performed as expected in most games, with three one-sided results.

The ease of the Greenock victory should be lauded as a confident performance considering the 42% win% at the start. The tight games against Poloc and Clydesdale show the step up in standard. Last year those games would most likely have resulted in a win, this year the opposition made it over the line in a tight finish.

The loss to Stirling was the least effective defence of a score that was likely to win.

How did individual bowlers contribute to this?

RIbowlers2nd.png

This chart shows the Defence Impact (how well bowlers did in chases). Those at the top in the positive bowled better than expected, conceding fewer runs than the opposition needed to win. Those in minus numbers conceded more runs, meaning their overall impact on defending run chases was negative. This provides more context than plain averages.

The other important factor is wickets. Taking wickets prevents teams from scoring runs (both tactically as run rates slow around wickets, and in terms of getting the best batsmen out). As we know, West did slightly better than the league average. So, let’s break that down further:

bowl2ndwickets.png

Generally, an average of 15.00 or lower is considered excellent. Considering West’s average score batting first, anything below 17.60 would also be strong. A strike rate below 25.00 paints a similar picture.

Lowtop wins the prize for average and strike rate, both showing the mark of excellence. He also took 2.66 wickets per match, bowling 7.55 overs per game. He bought his wickets with a worse than average Defence Impact (above).

There was then a pack of similarly performing bowlers: Quicksky was top wicket taker. His 0.60 wickets in 6.61 overs per match were perhaps slightly unlucky as he had more drops at slip than any other bowler. Northflood took 1.40 wickets per match (with an exceptional Defence Impact, making him a dot bowler in defence) and Kodak 1.14. All solid performances.

The rest were disappointing in taking wickets. The one name to note is Winter. The seamer was somewhat unlucky, having three drops from his bowling (66% success compared to the team’s overall 78%). He also was the most effective in keeping the run rate down to put the opposition under pressure, so his role may be changing.

From here you can see a clearer development picture building.

  • Even with low scores to defend aside, defending scores is inconsistent compared to Win%

  • Taking wickets is important. West did slightly better than average, but to finish at the top requires more bowlers striking in the second half to take 10 wickets.

  • Some bowlers are measurably better at bowling second, meaning those who have struggled this season need to find a method to better bowl at a chasing side.

In the next article, we will move on to some more general analysis of bowling.

Posted
AuthorDavid Hinchliffe

This is part three of the cricket season in review. This article looks at collapses while batting first in 50 over Premier Club cricket.

West of Scotland had two collapses batting first (107 and 94). As we have already established, these are two of the lowest scores of the season in the league, so warrant further examination as to what happened.

The main trend was losing wickets. In both cases, early wickets lead to further wickets (no recovery):

collapse1.jpg

Was this down to bad batting, good bowling or a bit of both?

collapse2.jpg

As you can see, there were not many more edges or bat being beaten than normal in either game. However, in the games you can see a couple of clear indicators of good bowling:

  1. The number of false shots per wicket (FSpW) was higher than usual meaning West batsmen got out earlier than usual, even though they made the same number of errors as always.

  2. Defensive shots per wicket (DSpW) were much lower in the Poloc game, suggesting that the bowlers were on top of the batsmen.

  3. Rotational shots per wicket (RSpW) In both games, theses shots were more poorly executed than usual. Generally, if the stat is far below the average, it’s because the pitch has made it tricky to rotate. So, we will give this number to the conditions.

  4. When a chance came it was more likely to be taken. Poloc caught every one of seven chances, a very unlikely occurrence as a strong performance is catching three from four chances.

So, it’s clear that Poloc bowled well. caught well and punished mistakes better than average. Prestwick did not bowl as well as Poloc but still made the most of West’s mistakes. One example of this is Bluecall opening in the Prestwick game and getting caught at deep point in the first over trying to hit a six. While it was a poor shot choice, the odds of Bluecall opening with a deep point who is a reliable catcher while he is facing are low.

What can we learn from this?

Assuming the opposition are ahead by either skill or fortune, how you “get out of the hole”? In the moment - when you don’t have access to the stats – and you find yourself in a difficult situation you have two options:

  1. Try to reduce risk by playing your highest percentage shots, which are rotational shots like pushes and glances (more on this later).

  2. Try to get as many as possible by attacking more often before the inevitable happens.

West tried both approaches at different times during these games. The only one that worked at all was o counter-attack, but it’s success was still limited, as you can see from the final score. Nevertheless, I would suggest you might as well try to score a few if you lose early wickets. This is especially true on tricky wickets. However it is higher risk, so many will disagree.

Posted
AuthorDavid Hinchliffe

This is part two of the cricket season in review. This article looks at batting first in 50 over Premier Club cricket.

The average score for West batting first was 184: An under-par number compared to 197 overall for the league in the last two seasons. West are in ninth position from 12 teams by average score.

batting1staverage.jpg

This happened for two reasons.

First, when West scored big, the scores were relatively low. The four high scores of the season are 16th, 28th, 29th and 38th highest. Seven teams had at least one better high score, Ferguslie had five, Stirling had three, and Poloc had two. West had none of the 13 scores over 250 or four scores over 300.

topscores.jpg

Second, during under-performing innings, the scores were relatively worse. Two scores in the bottom six places show when a collapse started, it wasn’t stopped.

lowscores.jpg

Anatomy of setting a target

Looking at the better scores, working out how those runs were scored will allow us to decide how to improve next year.

Tactically, the broad approach batting first was to build an innings for 40 overs then attack in the last 10 if wickets were in hand. The aim at the start of the season was to score 216 or more, as this provided a strong chance of winning. Here is the breakdown of the biggest scores and results:

westhighscores2018.png

As you can see, there is not much relationship between overall score and the result. Losing after scoring over 225 twice, but winning scoring 195. You can also see no correlation between the result and other indicators of the innings: control%, strike rotation, runs per wicket or runs per over. Boundaries was a slight indicator of success with both games where more than 15 boundaries score resulted in a win.

So, a side note here: While it is helpful to understand ball-park figures, it’s clear that there is no help from relying on target scores. Opposition can chase down more and fail to chase fewer runs.

Breaking down the innings highlights shows the tactical approach:

phaserpo2018.jpg

On average, after a brisk opening, the score accelerates from 66-2 from 20 to 103-3 from 30, 149-5 from 40 to finish on 217. The pattern of acceleration can also be seen in rate of scoring shots and boundaries.

AveSSandboundaries2018.jpg

How does this break down to individual batsman?

batfirstaverages.png

These are the top scoring batsman, setting a target. You can see Seashot, Abacus and Mayor were the set-up men (going at under four per over) while Kodak, Northflood, Cobra and Bluecall all played increasingly attacking roles up to nearly 5.5. Lower order batsman Bridge and Winter also chipped in with 110 runs between them.

The batsmen who attack more also have a higher RpSS (Runs per Scoring Shot). The batsmen who defend more tend to try and rotate the strike to make up the difference. The difference in style between, say, Bluecall and Abacus is clear.

This also throws out some interesting individual development points. Northflood has a high RpSS (2.26) but plays fewer shots than Abacus (1.49). This suggests more of Northflood’s attacking shots go for boundaries, and Abacus rotates the strike better. The two could perhaps learn from each other about their difference of approach.

You can also start to see the seeds of an issue: 64% of runs off the bat were scored below a useful rate. Seashot and Abacus are the extreme examples of this: averaging 25 runs per game below the rate needed to get past 216 as a team. Even when you combine the efforts of Kodak, Cobra and Bluecall going at a faster rate, they are unable to catch up.

The solution?

Make up the difference. Ask attacking batsmen score more quickly and have set up batsmen face fewer dots. Or have more attacking batsmen. Either way, it’s a greater intent to score.

We can see this in action in some specific games:

  • West vs Clydesdale.

  • West vs Meigle.

  • Stirling vs West.

In the first game West scored 213 runs off the bat (the rest in extras). The top six scored 197 in 287 balls (4.11 per over). Abacus top scored with 75. He came in an expected set up position: 63-2 from 15 overs (about -7 on Runs Added) thanks to the work of Seashot, Mayor and Northflood.  

Abacus’ Runs Added chart reveals an innings of three parts: slow first 70 balls, acceleration by strike rotation for 16 balls and a big finish. This is expected and, in many ways, classic batsmanship. You can also see there is still room for additional runs without additional risk.

RAAbacus.jpg

Runs Added (or R+) is a way of measuring batting performance compared to the average batsman in the league. Higher the number, the more runs the batsman has added. You can see from the above, most of the innings the R+ was in minus numbers between -9 and -5. Then there was a jump up to around -2 for a few balls before some boundaries took the final analysis into the black.

As a comparison, West’s Scottish Cup game Meigle was very different:

RAMeigle.jpg

The innings was dominated by two attacking batsmen. This slice of the innings is when or the other was in. The R+ hovered around 0 for about 70 balls before quickly moving up to over +20. At peak it was over +47 and the final score was 263. If it had been a league game, it would have been the 10th best score of the season.

There is one more innings to compare:

RAStirling.jpg

This is Stirling’s entire innings against West at Stirling. As you can see, it is far more classical in approach, sitting at minus for the first third, having a small jump up in the second third and then a fast acceleration to the end where 122 runs were score in 94 balls. The final score was 263.

The key point with both these latter innings is the slow portion was less slow and the final push was greater than West managed.

So, there is an opportunity for West to better balance the tactical approach. Either with a Meigle style attack through the innings, or the more traditional build to a final push style done with more pace.

That is a tactical decision for the captain and batting unit to consider and practice over the winter, but as the evidence suggests, it is something that is possible with the right batsmen and mindset.

In the next part we will examine the batting collapses of the season to try and prevent future ones.

Posted
AuthorDavid Hinchliffe
IMG_4624.JPG

Over the last couple of years I have produced a season review for the 1st XI of the club I coach: West of Scotland Cricket Club.

Here is 2016 and here is 2017.

2018 will be more detailed again, as I gathered more information than ever before. I will post it all here for you to see. This time it's at the highest level of club cricket in Scotland: Premier Division.

As a result, it's hard to take performances from last year into this year. For example, the first target score batting first last year was 173. This year it was 216 (and it turned out to be a good summer for batting). However, as a reminder, here were the thing we were looking at from the last two seasons in Division One:

  • Maintain wicket-taking consistency in the face of much better batsmen.
  • Improve chasing with the bat.
  • Improve run scoring batting first.
  • Get more direct hit run out attempts.
  • Take more catches.
  • Get a feel for what is required to play at the higher level.

Over the next few articles, I will delve into these questions and many more and come up with my plans for 2019.

As an overview, West finished in 6th place in the Division. The XI won six and lost eight games: Two wins were setting a target and four wins chasing. This is against the general trend of the league, which saw a roughly even split (51%-49%) between setting and chasing.

In the next article I will examine the batting performance when setting a target.

Posted
AuthorDavid Hinchliffe

I had an interesting chat yesterday about how you plan and implement a junior training programme. As we discussed it, I found myself saying one thing above all others:

"We need to know why."

That's my shorthand way of asking about a whole bunch of factors that go into a plan beyond the practicalities of coaching cricketers. Asking "why?" is a simple question but the answer gives you the culture, the aims and goals, and the indicators of success.

Unless everyone knows and agrees why, how can you be sure you did well?

Unless everyone knows and agrees why, what will stop you pulling in different directions?

When it comes to kids training, understanding why works in two directions:

  1. Coaches can coach based on clear aims and be measured on how they did. Results are better.
  2. Players can be coached with a clear mind on why they turn up every session. Performance and behaviour is better.

With a clear purpose being driven home relentlessly by everyone (including the players), you become more successful.

So, before you get into the nitty-gritty of actual coaching, make sure you know why. It will help you in the long run.


Posted
AuthorDavid Hinchliffe
Proper planning prevents poor performance! Partick win the Greenwood Trophy

Proper planning prevents poor performance! Partick win the Greenwood Trophy

The season is drawing to a close, and a few very sensible cricket people have been in touch with me about winner sessions. But without a plan, those sessions will be wasted.

So, if you have any ambition to do well in 2019, now is the time to start planning your off season. Good planning leads to helpful practice leads to more runs and wickets!

With this in mind, I'm offering a planning session (either in-person or online) with any cricketer at any level . If you take this up before 3rd September 2018 you can get it for just £10.

What I can help with:

  • Reviewing your season and identifying strong and weak areas: Technically, tactically, mentally and lifestyle.

  • Deciding what kind of training will help you best over the next eight months leading up to the 2019 summer.

  • Spotting potential opportunities to add extra "bang for your buck" and spot any individual barriers to improvement.

  • Give you an ear to voice you frustrations and fears.

  • Providing a comprehensive plan to cover the period up to Christmas, or into the spring.

  • A net session (if local to Glasgow).


Posted
AuthorDavid Hinchliffe
West of Scotland Cricket Club, Glasgow

West of Scotland Cricket Club, Glasgow

We all love to talk about rotating the strike more. About letting the opposition bowl too many dots. About controlling the game. It's easy to mention off hand. 

But, what does effective strike rotation look like?

To give you a benchmark, Most teams in the WDCU Premier Division, where I coach, score from a third of the balls they face. Not as many as you thought perhaps? 

Generally, the team I coach - West of Scotland - are good at it compared to the opposition. West score from, on average, eight more balls than our opponent. There is a higher Scoring Ball Percentage (SB%) in half of the matches so far this season, with about two thirds won. So, while it's not a perfect indicator of success, it certainly helps.  

But to really improve strike rotation, we need to work out what we are missing, if anything

What runs are really missed?

Any ball can be a dot, rotated for runs or hit for a boundary. Clearly the optimal is to hit six from every ball. Even more clearly this is so astronomically unlikely as to be impossible.

What is more realistic?

Hitting a boundary is still a better result because you get more runs, but it is also riskier: Attacking shots like a pulls, drives or cuts will score 22 runs per wicket at 2.3 runs per shot. Rotational shots like glances, pushes and flicks get you 54 runs per wicket but at a much slower 1.4 runs per shot. That means there is balance to be made. A rotation could be a positive or a negative: An extra 1.4 runs (instead of a dot) or 0.9 runs missed (instead of a boundary).

So, to see how well we rotate, we need to look how many runs we score with:

  1. A shot that was not intended for the boundary (hitting it to long off for a single for example).
  2. A shot that was in control (not an edge or miss hit).

It's the number of these balls we are trying to increase.

In over 3000 balls this season, The XI have done this 626 times: 48 per game. In comparison, the opposition average 40 per game. So West are ahead again.

However, the better question is not "how often does this happen?", but "how many runs do we miss"?

  • There have been 2189 dots so far this year.
  • There have been 442 controlled attacking shots played that did not go for a boundary (although 65% of those balls got some runs).
  • There have been 407 controlled rotational shots played that were dots.

In other words, a potential 43 rotated runs were "missed" on average per game. That's not including the 27 extra missed runs from attacking shots as well.

Of course, this is an optimal figure. No one will ever really score from every controlled shot played; there's too many external factors. Like good fielding.

But when you know what you could have won, you can have confidence you can sneak a little bit more.

An additional six extra balls rotated would get you eight more runs a match. An additional six balls that were attacked and scored from would get 14 runs (one or two in boundaries). 

Two overs more for 22 runs sounds good to me!

And how do you do that?

Forget the stats: It's about intent

All those stats can't help you much in the middle. What they can do is give you confidence for a simple philosophy: You look to score from more balls.

Coaches call this intent to score: The idea you are looking to find a way to score from every ball. A bad one might be a boundary, a good one might be rotated.

The point is, knowing there are a lot of wasted chances every game can give you the confidence to look for them.

We all play and miss, edge the ball or miss hit it. We may do it a bit more if we are looking to push on. But these stats show there are a lot of missed runs in every game even when you take out those poor shots.

It might look like a tiny insignificant improvement to score from 12 more balls, but not only is it possible, it also makes winning significantly more likely.

Just from a bit of intent.

Posted
AuthorDavid Hinchliffe
"Batting in the easy net, or having throw downs that are half volleys, or even putting the bowling machine on hitting half volleys for half an hour. These aren’t going to make you better... the key to becoming a better player is to make training tough and to get out of your comfort zone."

Joel Hamilton is right

It's not a new message, yet how many players still go into a net with no clear plan, and come out with no clear idea of what's happened?

Quite a few!

This year at my club I have noticed people saying "you need to come to nets" after we lose. It's an easy thing to say, but if you come to nets and fail to challenge yourself in areas you need to improve (either making strengths stronger or reducing weaknesses) guess what happens?

Nothing!

The route to success is paved on all sides with failures. Seek them out and learn from them.

Posted
AuthorDavid Hinchliffe


"In recent times, [England]... knew their numbers, they were precise. They had their theories. Three maidens leads to a wicket. If a player in your top three scores a ton in an ODI game, you’ll generally win. It’s a mindset of conservative trust in your plans and in pre-determined patterns of play prevailing. Sam Curran, and particularly his display in this match, couldn’t be further from that era... Today at Edgbaston he showed he’s a gambler, and he broke the Test right open."

Sam Curran swinging England back into a Test match is a great story. But it's this above quote I'm interested in. The dicotomy set up is trusted plans versus confident gambling. And it's clear CricViz prefer the latter.


But how different are the two options?


You can have a plan that is based on precision and conservative trust and also be able to take a risk based on a hunch. To me they are not in opposition.


It's a little like driving. Here in the UK - where roads are among the safest - there are strict rules that allow you to get to your destination safely and efficiently. If you ignored those rules totally (running red lights, driving the wrong side of the road, breaking the speed limit and so on) in the hope of getting somewhere more quickly, you would likely have an accident. Reckless abandon is not a good solution in any situation. At best, you get away with doing something silly.


On the other hand, if you stick to the letter of the Highway Code totally, you will sometimes find yourself in situations that slow you down. Unusual road layouts, or safe overtaking for example, mean you have to "break the rules" to remain safe and efficient. This is mindful execution of skill. You are not shackled by premeditation. You are still largely following a plan, you are just adapting to changing situations as you go.


Remind you of batting?


I'll give you an example. You are driving on a two lane road in traffic that seems to be getting heavy up ahead. From the way the traffic moves, you get a sense for needing to change lanes early. If you wait too long you end up slowing everyone down by changing lanes in heavy traffic. But you can't be sure a lane change so early will be helpful yet. Your instincts just tell you it's time to go and you make a decision in the moment. Get it right and you reach your destination sooner. In cricket, you can have a similar sense. A bowling change brings on someone young who looks nervous. You can't be sure, but you think this could be the player to take a chance at attack. You make a decision in the moment. Get it right, and your chase looks confident as you blaze past the target.


In other words, there is room for both safety in a well-established plan, and an instinctive breaking from the plan in the moment.


To return fully to cricket, you could argue Curran took too many risks and just got lucky. He seemed to run a few red lights! Yet, more important than the level of risk, he clearly felt able to make a decision and go with his own way.


As coaches, our job is to create an environment where this can happen. There will be rules and theories and plans. Yet, there will also be a feeling of "trust your gut". If a player feels the situation requires something outside the plan, they must feel able to try.


In Curran's case, it worked. In many other cases it will not. It almost doesn't matter.


As long as the player can walk off the park - performed or failed - with their head high saying "that was my plan" then there are no recriminations from the team, the captain or the coach. That's a great culture, great mindset, great team spirit and a team with a good chance of success.

Posted
AuthorDavid Hinchliffe


FullSizeRender.jpg

Recently, we had a middle practice with a range of players at different standards from juniors to established first team cricketers.


I have written before about why I prefer middle practice over nets. The short summary is this: Practice is more realistic. Decision making expands from pure shot selection into calling and running, batting in game context and a feeling of pressure.


But alongside this huge benefit are issues. Players tend to switch off after a few overs. There is a wide range of standards that need matching up. Players don't all treat it like a game so don't feel the benefits.


These issues used to frustrate me. I used to get annoyed when players didn't "buy in" to the practice. In all honesty, I do still get a bit annoyed, but now I ignore that annoyance and see every reaction as an opportunity to learn more about the players I coach and hopefully engage them in discussion about how to improve.


This last session was a great example. Some of the things I observed:


A player taking charge of running the session, especially guiding the juniors, showing great leadership potential, and a strong personality.


The players self-organising after some pushing by me into middle practice. I suggested some rules, they customised them to match their needs and got on with it.


Some players not engaged with the session unless they were actively involved in batting or bowling. I observed this was a consequence of a certain mindset (not wanting to field).


Other players coming up with suggestions to improve things and add more critical moment feeling to the session. This shows the importance of reflection both in the moment and after the session is over.


One of the key points for me I tried to get to the players was that you get as much from these kind of sessions as you put in. If you think it's going to be rubbish then it will be. If you focus on working on key things you can't get from nets (running, bowling to a field, batting to a target) you will get something.


Whatever happens, all player responses are a chance to learn: What they think about practice, how they behave in a training environment, what inspires them, what bores them and what choices they make in the moment.


From here you can reflect with them. How can we get to a place where we can improve the things we need to improve? In the moment, did we do what was best?


Perhaps that does need the occasional "you are doing this" from the coach if the players don't self organise in the way they have previously said they want to. But the dream outcome is the players realising and adjust within and between themselves. That way they are using this struggle to learn and improve. That takes space for action, space for errors (in behaviour as well as performance) and time for reflection.

Posted
AuthorDavid Hinchliffe

Recently, I was in a conversation with some passionate coaches, talking about parent helpers. The general gist of the chat was; 

”They are great to help but they don’t actually do any coaching. We need to have a coach or experienced player at junior games so they can tell the kids what to do.” 

Contrary to popular belief, that’s not coaching. If anything, it’s the opposite. By telling kids the answers they never learn to be creative, adaptable, problem-solvers on the pitch. They rely on advice from on high. Advice that may or may not work!

(In fact, later in the same conversation one coach was bemoaning a dad who was offering terrible advice to his son. Not all advice is equal!) 

I prefer an approach called “The Way of the Silent Coach”. It’s not really silent, but it does have far less telling, far more questioning and far more building an environment where players feel comfortable to work it out themselves. Albeit under my guidance and questioning. 

Click here to read more about it.

There are many critics to this way. I was one of them for a long time. So, I appreciate the arguement. Telling a kid what to do can be super effective. Sometimes you need to do that, but it’s a lot less often than you think.

Why? Because people love having space to play, try things, fail, try again and keep going. That’s partially why computer games are so popular. We have freedoms in those games away from people telling us what to do and how to do it. We play, learn and play again.

Posted
AuthorDavid Hinchliffe
summercamp.jpg

I will be running West of Scotland Cricket Club's coaching camps this summer. The camps are ideal for activity-loving boys and girls aged between 9-16.

The camps run on the following weeks:

  • July 9-13
  • August 6-10

For full details contact me here.

The action-packed camps are all day cricket activity sessions come rain or shine. The emphasis of the camps are to help keen is challenging and fun sessions with the West coaching team.

The team also includes Trevor Garwe, Zimbabwe International.

West's unique indoor cricket centre means we can keep busy even when it's raining. The centre is equipped with all the tools to improve batting (bowling machine, sidearm ball throwers) and bowling (PitchVision video analysis and ball tracking).

When the sun shines we can work outdoors on all skills. The coaching and technology on hand in unrivalled anywhere in Glasgow (and far beyond)!

Either way, a week at West is guaranteed to improve your cricket, and be very enjoyable!

Camps are £150 for the full week.

The camps are open to all young players from any club, and are ideal for junior Western Warriors players and hopefuls to make the next step in the game.

For full details and to book contact me here.

Posted
AuthorDavid Hinchliffe