This is the first in a series looking at the 2017 season for McCrea West of Scotland. This section analyses the bowling performance.
There's no doubt that bowling is West's best skill set. Partially this is due to bowler friendly conditions, but the bowling unit is also well-established and balanced.
Tactically, West built on the good work of last year. The template was to open with real pace, turn to the spinners and bowl opposition out for a below par total. This worked a treat with West's opposition averaging 106 when chasing (143 batting first) and the game finishing inside 32 overs.
This was mainly caused by,
- A high number of dots: 4.42 Dots per Over (DpO).
- Fewer errors: 62 fewer wides than the opposition in 2017.
- Fewer boundary balls: West bowled a boundary ball every 59.84 balls, but hit a boundary every 17.32 balls.
This broke down slightly differently than last year.
Fewer wickets fell in the first 10 overs, with an average score of 30-2. This was more than made up for in the following 20 overs, with opposition on 91-7 after 30 overs.
Here is the breakdown of runs and wickets by 10 over phase:

Average RpO for each 10 over stage.

% of balls scored (and dots bowled) by spinners and seamers.
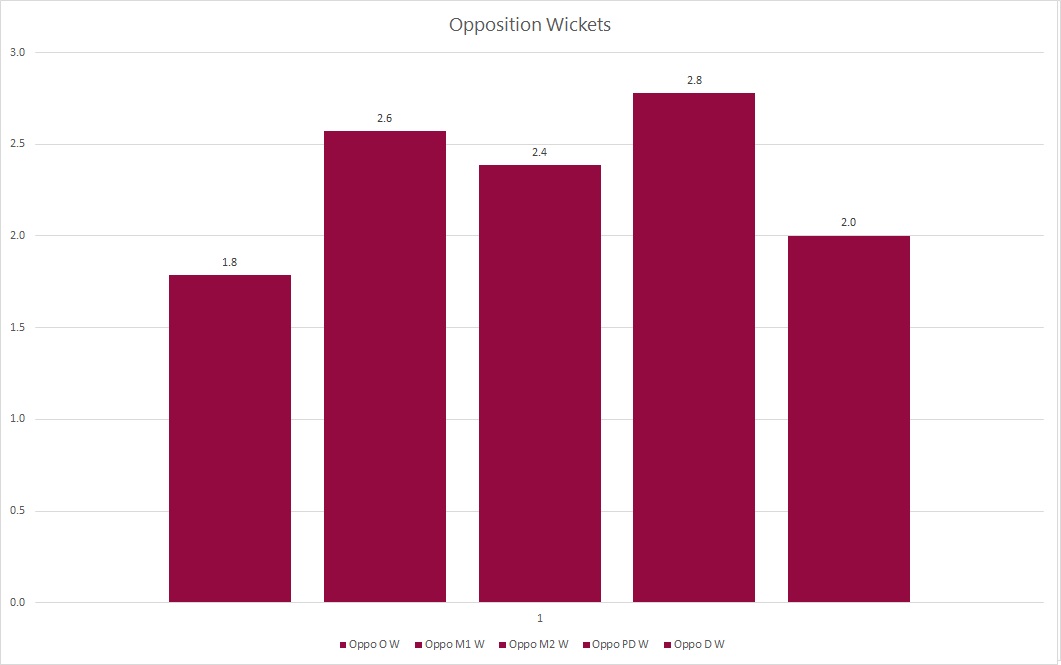
Average wickets falling at each 10 over stage.
This was caused by six main bowlers: Four seamers took 67 wickets in 305 overs at 13.12. Two spinners took 40 wickets in 108 overs at 14.03 (under 15 is excellent).
Most wickets were out caught, as you can see below, although not as many as you might imagine. Bowled and LBW combined made up about the same number of dismissals, which reveals West bowlers are very good at sticking to the "bowl at the stumps" tactic:

We will look in more detail at how catches were taken in the fielding analysis.
Innings breakdown
The same two pace bowlers were used up front in the first 10 all season. Their performance last year was stellar, but in 2017 it was a touch more containing than wicket taking. Bowling average was 19.81 in the opening overs, which is higher than hoped because our main strike bowler took fewer wickets (7 at 24.14).
However, the containment stats speak for themselves:
- 4.58 DpO
- Opposition Control Percentage (C%) at 62%, with the bat beaten every 4.09 balls.
- At least two chances created every game (72% taken).
With the aim to have an average below 15, DpO above 4.1 and C% below 71%, it was a start that kept the runs below 30.

Averages for overs 1-10 (DB% = Percentage of Dot Balls, C% = Batting Control Percentage)
This work was followed up in the next 20 overs with some outstanding bowling from a trio of bowlers.
The overseas fast bowler took 18 wickets in this phase averaging just over eight. He was kept honest by the left arm spinner who took 21 wickets at just over nine.
The other main bowler was a nippy medium pacer who had up and down form. However, he caused trouble bowling early (overs 11-20), when he averaged 12 in 21 overs bowled in this phase. His form later in the innings was less convincing, which we put down to losing a bit of confidence after a technical flaw crept in. We will work on this over the winter.
Despite less control over the run rate (RpO crept over 3), creating chances and taking wickets (74% of chances taken) in this phase of the game allowed West to control matches.
Overall the numbers were impressive, with the most dominant phase between 11-20 overs:
Overs 11-20
- Average 9.91
- Strike Rate 21.64
- RpO 2.75
- DpO 4.42
- C% 70%
- Beat the bat every 6.38 balls.

Averages for overs 11-20 (M1 Phase)
Overs 21-30
- Average 14.50
- Strike Rate 27.82
- RpO 3.13
- DpO 4.26
- C% 70%
- Beat the bat every 6.80 balls.
This dominant phase led into the "predeath" overs from 31-40, where West were almost always totally in control of the game by this point.
The dominance of this phase is overblown because so many wickets had usually fallen, but West's bowlers at this point did not release the pressure and the game was often over before the 41st over.
The same bowlers also did damage here, as did a new bowler, a leg spinner, in his first season. He took 9 wickets at an average of 9.22 with C% down at 62%. This was mostly against weaker batsmen, but nevertheless it was an outstanding return (beaten only by the left arm spinner who was even more astonishing, taking 9 wickets at 5.33 in the pre-death).
The leggie also showed he could do it earlier in the piece, taking 7 wickets at 12.14. His RpO was a little high but he also created a lot of chances, as you would expect from an wrist spinner.
At the end, West did not have many death overs to bowl: 35 all season. No one bowled more than 60 balls in the death all year, so it's hard to judge performance. The RpO of well under 5 shows it was a done deal in most games.
Shot analysis
The final element is a breakdown of the types of shots that were played, and what we can learn about West's bowling.
This year, games included analysis of shot type for each bowler in four broad categories: Front and back foot defence, and front and back foot attack. The former is shots like the forward defence, back foot punch and flick off the legs. The latter is drives, cuts, sweeps and pulls.
This was an experiment to see if we could work out what kind of shots were most and least effective against West bowlers. It also shows (roughly) what kind of lengths each bowler bowled.
As you can see in the chart below, the most dismissals came from defensive shots on the front foot. There was a fairly even balance between bowled, caught and LBW. This is interesting because we generally assume catches will always be the largest by some margin, but West bowlers seem to be better at bowling at the stumps on a good length leading to three main dismissals:


Breakdown of what show was played to each dismsissal.
As expected, catches were more dominant in the other shots, especially when batsmen attack. It shows how important it is to bowl at the stumps to almost triple your chances of a wicket.
We can build on this by looking at the Strike Rate of each shot type. Remember the overall SR was 22.76:

The most likely form of dismissal is the back foot attacking shots (BFA), which are mostly played to bad balls (long hops). Bouncers are an exception and, while we did not record the number of bouncers bowled, there were not so many to account for this.

Individual SR, showing how bowlers differed in type of shot per dismissal.
The lesson here is that a bad ball can get a wicket too, and this season it did it very well!
A word of caution is that back foot attack shots were West's strength, second only to back foot defence in strike rate (39.80 and 58.50). Perhaps it reflects poorly on opposition batsmen's ability to hit long hops and short balls from the seamers on the ground; certainly an indicator that Premier League teams will not be so willing to waste the chance of a bad ball by getting out.
The SR certainly doesn't stop the opposition scoring from short balls, as the SB% for BFA is 56.44% and for front foot attacking shots (FFA) is 53.65%:

All this leads to an interesting tactical discussion: Clearly pitching the ball up at the stumps gets a lot of wickets at an excellent strike rate around 20. It's also clear that bowling shorter is not as effective for wicket taking when the batter defends. When they attack, a wicket falls every 13 balls! Can this be exploited? We will consider the possibilities over the winter.
Bowling accuracy
It's handy to record bowling accuracy to compare it to the line and length figures we get from PitchVision. However, this was not done directly because I don't trust judgement of length from the edge of the boundary!
We did look at an alternative: counting a good ball as one that resulted in a dot from a FFD. Imperfect as it was, it seemed to be a good rough guide. However, the results it spat out did not correlate to other measures of bowling skill like RpO, SB% and C%, and we could not work out why. We gave up on the idea and instead present an overall set of stats that contribute clues to accuracy based on outcomes:

This season it did not matter much, as even the bottom bowler in the list had a decent season in every category. The top couple of places were interchangeable with four bowlers. Next year we may look at other ways to measure length and line stats. It's important to remember that the outcomes matter most, rather than if you hit your lengths (one tends to lead to the other anyway).
We can be sure of a few things:
- Bowling a good ball does not automatically result in a favourable outcome.
- Bowling a bad ball certainly does not result in a bad outcome (and can result in a wicket).
- Improving these figures by bowling more good deliveries (stock balls and variations) is a solid aim.
- Tracking accuracy in games - as well as training - makes sense because players are under game pressure and not just running in at nets.
Moving forward
With the ball, the season was so dominant it's hard to find lessons to learn.
Even against strong opposition, the bowling was superb, never going for more than 179 all year. Even against the might of Heriot's in the cup; West kept them to 3.3 per over and had them 9 down. Against weak opponents, the bowling was incredibly overpowered, bowling teams out for under 100 five times.
That said, West could do better upfront, as the main strike bowler was out of form (by his standards). We have already started the process of getting him back on track for next year.
The fourth seamer was inconsistent and he needs to work on a technical issue. He needs to improve to become more consistent and find a role in the team. The balance of the side could do with a third spinner who turns the ball in to right hand bats. There are a couple of potential recruitment options in the works there. But that is all still in the air for a while.
We also need to be mindful that overs 30-50 saw no real challenge to the bowlers all year. We can look to focus on bowling under pressure at this stage over the winter.
The realistic challenge over the winter is to impress on the core bowlers the need to maintain and improve good lengths with no loss of focus on pace and rip: They will get away with fewer bad balls.
It's a possible option to look at ways of taking wickets with shorter balls. Bouncers show some potential as the data has show a great strike rate when batsmen go for shorter balls. That is for discussion rather than a sure thing.
Nevertheless, the unit is a great combination of control, raw pace, big ripping spin and good seam movement. As it is right now, I am confident they will win matches next year.