In the second part of my review of the 2017 cricket season, batting is examined.
2017 was a dramatic improvement with the bat over the previous year, although there is still some work to do now promotion is secured.
Due to all the extra analysis, the work can be identified very specifically and we can look to add extra dimensions in the knowledge we will be up against stronger bowling attacks next year.
Let's go through it now.
Tactically, the aim was to bat first, build a total we knew we could bowl at and win with the ball. This worked in every game that we reached our goals.
Sadly, on the few occasions West chased, it looked far less convincing, winning two and losing two despite chasing low scores. More on that later.
Setting a target
At the start of the season we identified three scores as targets when batting first:
- 130: Minimum score that gives at least a 50% chance of winning.
- 173: Par score, giving an 80% chance of winning
- As many as possible: No limit once moving past par to prevent a feeling of restriction.
West went about this in a traditional manner, accelerating through the innings. Broadly the aim was to get 35 in the first 10, be on at least 90 by over 30, score 50 between overs 31-40 (predeath) and look to hit out in the last 10 if wickets were in hand. As you can see this worked well:
Average RpO at each 10 over phase
Every phase exceeded expectations except the death overs where performance was mixed. That is certainly an area of focus for next year.
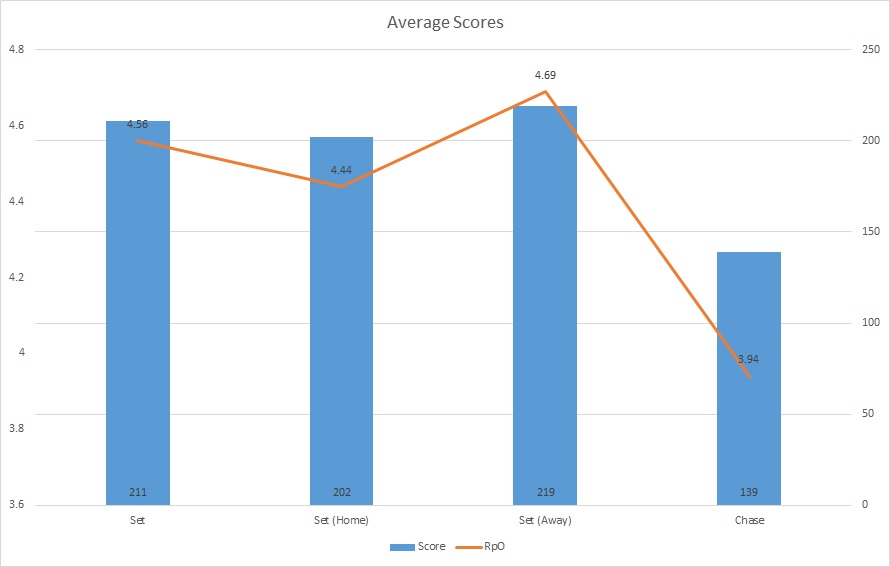
The average score batting first was 211.
This was exactly according to plan. The highlights were 347 (admittedly against a very weak side), 260 and 270 against league opposition and 202 against a Premier side in the Scottish Cup. There was also an exceptional rain affected performance, getting 170 in 30 overs which the DLS told us was worth almost 200.
The only real lowlight was struggling to 135 against Heriot's in the Scottish Cup. Even though conditions were difficult and the bowling was exceptional, 173 was still a viable target.
This target setting worked well as a way of focusing the mind for players. It will be repeated next year, but the targets will need to go up as Premier League scores are generally higher.
Chasing Runs
West's chasing skills were less effective in 2017, although this was based on fewer games. If we include a preseason friendly against a local Premier League team, two matches were won and two were lost.
Clearly, it's hard to read much into such a small number of games, but the two losses chasing 166 and 141 are a concern when you consider West blazed past 200 several times batting first, and only got less than 170 once. The highest successful chase was 133.
Why did this happen?
And how can it be prevented?
The plan, as with setting a target, was to score in phases. The first 30 overs can be played exactly the same: Score 35 in the first 10, be at 90 by over 30. West know that 90-5 can reach past 200 if we stay calm and play the game. This happened in the one win, scoring at 32-2 (10) to 125-5 (30) setting up a win on a flat pitch.
In the other games things were not much different:
- Chasing 166: 33-2 (10), 96-6 (30).
- Chasing 141: 28-0 (10), 91-6 (30).
So the difference boils down to one or two wickets too many falling in the first 30 overs. The rate was fine (slightly better than strictly needed) but those extra couple of wickets show the difference.
In both those games we were one or two top batsman lighter than usual, but this does expose what happens when no one takes the game by the scruff of the neck as we did in other matches (Kelburne and GHK were examples of a collapse and recovery).
To prevent the chances of this in future, we are going to work on two things. First, make sure that we head into the last 20 overs with five or fewer wickets down. This will help build confidence.
Second - for those times when backs are against the wall - develop a "never say die" approach to chasing runs. West have the ability to keep up with the rate, even when wickets fall. The mentality of "keep going and we will get this" needs to be ingrained even in the face of climbing run rate and falling wickets.
Next year, scores will be higher with 170 the new 130, and 210+ a par score. That can only be done if the mindset is one of determined fight, even when times are tough.
Individual contributions
It's worth examining how these runs were scored both setting and chasing.
West used 18 players with the bat in 2017. 13 faced more than 30 balls to be included as a "regular". 10 of those batted in the top seven which makes them a top order batsman. The others we will call the lower order (not in for their batting specifically).
Notably, one player from this started as a lower order batsman, did well and moved up to the top order, mostly at seven. He spent more games at six or seven than eight so we will count his runs as top order.
The top seven scored 92% of the runs - up from 72% last year - at an average of 24 per game. One batsman passed 400 run, three were in the 300 bracket (I'm counting one who got 290), and two passed 100.
This is a huge improvement on 2016, where the lower order had a much bigger role in recovering the team several times. This year they did not have as much of a chance, but it is a testament to those guys skills that one broke through as a batsman and another still managed to score over 100 runs in seven innings at 19.33.
For the record, that's 10 players breaking the 100 run mark.
We set the target of five more runs per batsman, and it was done. A great team effort.
Strike Rotation
One of the stated targets in 2017 was to improve strike rotation and get more runs from the same number of balls. The simplest measure is Scoring Ball Pecentage (SB%) which is the number of balls a run is scored from.
SB% was up on last year from 32% to 36%.
Breakdown of % of balls scored from
Even better, When an innings exceeded 36% SB% the average score rose to 236. When it dropped below the the mean, the score dipped to 196. This is still exceptional but highlights the importance of good strike rotation, and something else that can be maintained in a higher division with hard work in the winter.
For the first time, we also tracked how SB% changed over the innings. As you can see, it also tracked along with RpO:
Naturally, we wanted to see how much of SB% was caused by pure strike rotation skill of the batsman.
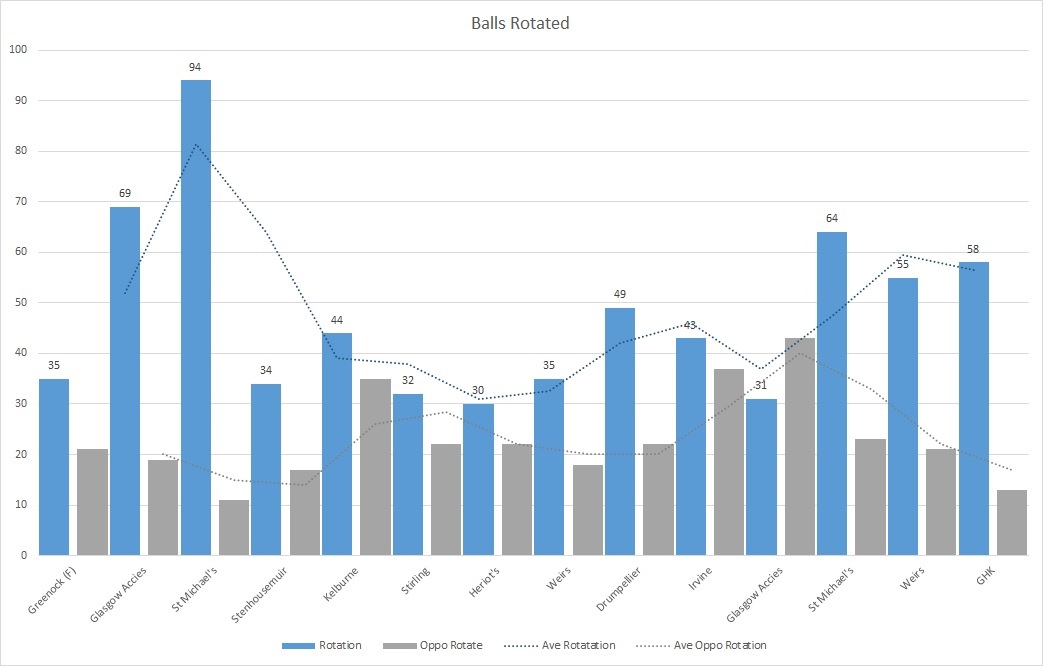
First we looked at Balls Rotated (a subset of SB% made up of non-boundary runs scored from shots like pushes, flicks, nudges and drop and runs). The average was 48 balls per innings (18%). This was compared to the oppositions 23 (11%).
Balls rotated per game, with a rolling average
In above average scores the average BR went up to 66, showing the benefit of rotating the strike on final score.
This was also examined per batsman. Here's how the top batsman did this year at rotating:
Breakdown of rotation, SB% and stolen single averages
You can also see in this table we have tracked "stolen runs". These are the classic drop and run, taking on the arm to get a second or other cheeky runs the opposition are not expecting.
These are the first time we have looked at these numbers, so we did not have any targets, but now we know the benchmarks, we can work to improving all batsmen's ability to turn dots into runs, and push average scores up.
We can also use these stats to show batsmen their style (more rotation or more hit out). From here we can get best practices from those who are better than others at hitting the gaps and running hard. It's a great skill and one that is not often measured and tried to improve.
It looks like SB% can be considered great over 35% and acceptable over 30%. Rotation is fine over 15% and stolen average is OK over 2.00.
Boundary hitting
This year, boundaries became more important. Last year it was all about strike rotation to boost scores, but looking at boundary numbers, it seems they have crept ahead in the priority list slightly.
West hit a boundary every 18.67 balls against seamers and 19.11 balls against spinners.
When the RpO was below the mean, there were an average of 11.33 boundaries (26.46 Balls per Boundary). When RpO was above the mean there were 23.25 boundaries (12.31 BpB). This clearly shows a difference to last year, when boundary numbers hardly changed and strike rotation was the biggest driver in getting higher scores.
Our guess is this is because of more boundary focused batsmen getting more runs this year. Three of the top order are much happier hitting the rope than pinching four singles. The other main batters (including the pro) strike a balance but can all hit a long ball as well as rotate with skill.
BpB and Runs per Scoring Shot give a picture of how much batsmen rely on boundaries to score.
This was an unexpected but welcome development. A balanced side presents a range of challenges to the fielding team. A couple of boundary hitters cause headlines, meanwhile the strike rotation guys can pick up more runs in the gaps left.
It seems a BpB of 12 or lower is a good target for most batsmen, however if the batsman is a "hitter" that number needs to be lower to account for fewer runs scored with rotation.
Moving forward, we will work on developing boundary options for all batsmen, especially in the death overs where West underperformed: Either more shots for the guys who already do it well, or better execution for the guys who prefer to rotate.
There's always a way if you ask "how do we make 17 BpB this year into 15 next year?" Two extra boundaries is 8-12 more runs and would put West in the top average score for Premier cricket!
Control
Last year we started to look at Control % (C%) for the team as a way of predicting wins.
C% is a judgement on the batsman: did they play a shot under control or not. Beaten on the outside edge or nicking off is not in control, hitting a four over the bowlers head is usually in control! The most useful point was that if the team C% was above 77.7%, West won most games.
This year we expanded the metric to also include individual batsmen and what type of control we saw: on the ground, in the air, beaten and so on. This lead to an overall drop in C% for the team as we could track what was controlled more accurately.
The most notable point from this is that C% and RpO had an almost perfect correlation (batting first):
This is not a huge surprise: The more balls you control, the more likely you are to score runs. However, for it to track quite so closely is interesting. It shows us that luck is not as important as skill (in team run scoring at least).
We also noted that the old rule of 77% did not apply here. Partially because the overall C% dropped as we fine-tuned the metric, but mainly because West won all but one game batting first regardless of control.
C% for the year was 75.54% which did not track closely to wins.
Games were won with C% as low as 71% and lost with as high as 76%. You might think that these numbers depend on conditions, so we looked at comparing C% with the opposition. A higher C% than the opposition did correlate to a higher chance of winning, but it was not a guarantee.
Comparison of C% per game (red bars are lost matches)
C% is a good measure of consistency. The smaller the gap between the best and worst, the better the consistency of the team. West saw a difference of 14% between top and bottom C%. Opposition C% varied by 35%. Our sense is, on better wickets in the Premier League, this consistency has every chance to improve (and the opposition's will certainly not be as bad).
C% against different types of bowling is also useful to see how the team did against seam and spin bowling
As you can see, control was different between seam and spin. The ball was left more and the bat was beaten more against seam. The ball was hit more under control against spin but overall control (leaving the ball counts as in control) against both are good: 80.81% and 84.15%
We learned that the overall C% is useful, because it focuses the mind on playing with fewer errors. However, it is not a magic metric that reveals every secret about scoring runs and winning games. It's merely a guide that reveals more about your performed than the runs alone.
C% also allows you to see at a glance how well you are doing during the game.
If you are keeping up with the run rate but at a much lower C% than the opposition, you are still likely to lose unless you get lucky or turn that control around. For this reason, C% is updated live during West games to keep eyes locked on how well the batting is going.
A useful addition this year has been individual control stats for players:
The headline is as you would expect; more control means more runs for individual batsmen. We also found it a motivational metric for batsmen. We can see which batsmen stayed in control and built innings, which ones rode their luck with lower control and more runs, and which batsmen were unlucky, having good control but a lower average.
You can combine this by looking at what kind of control the batsman had. For example, if you are getting beaten a lot more than average and leaving the ball less (as one of the batsman above) you can look at why this is. Perhaps judgement of off stump needs work, for example. It's a strong way to further assess performance.
We are also able to look at C% of different shot types. As with the bowling, we had four shot categories and can see how well the team did:
C% for front and back foot shots
SB% for front and back foot: back foot is more productive by a significant amount
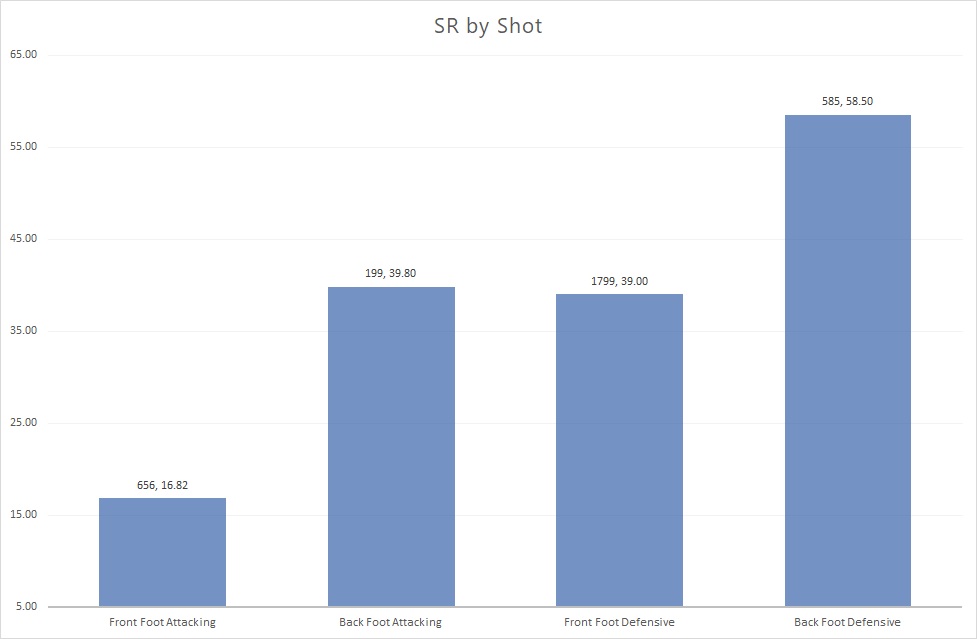
Strike Rate (balls per Wicket) of each shot type: back foot play is much safer.
The only surprise here is how much better West batsmen are off the back foot. With most balls played on the front foot, you might imagine back foot shots might not be as efficient. That was certainly the case with opposition batsmen who were much worse on the back foot. For West, when the ball was shorter, the batsmen played better.
One explanation of this could be the practice nets. They are fast, bouncy and good to practice off the back foot. In the past many have criticised the difference between indoor nets and Scottish wickets, but if the results of years of indoor practice on concrete makes a team of great back foot players then perhaps it's not so bad after all.
Summary
Division One opposition top bowlers are generally better than the batsmen, and bowling depth is better too. So, while West bowlers will take the headlines for not dropping a game, the batsmen should take some quiet applause for consistently putting a plan into action in difficult circumstances.
A couple of slip ups aside (and even those where more about wickets falling than intent to score) the batting consistently beat scoring targets, passing 173 seven times from 10 and never scoring less than the minimum aim of 130. In most cases this was done with confidence even in the face of wickets falling.
While chasing was more of a concern, the performances were almost there and with some more work over the winter on chasing, West batsmen will feel confident of going into any match with the skills to take down the best.
It may be a tougher season to be consistent with the bat in 2018 because of better bowling and confidence needing to be built that the team are able to compete, but getting over that hump will see this group of players become formidable in the next few season.


